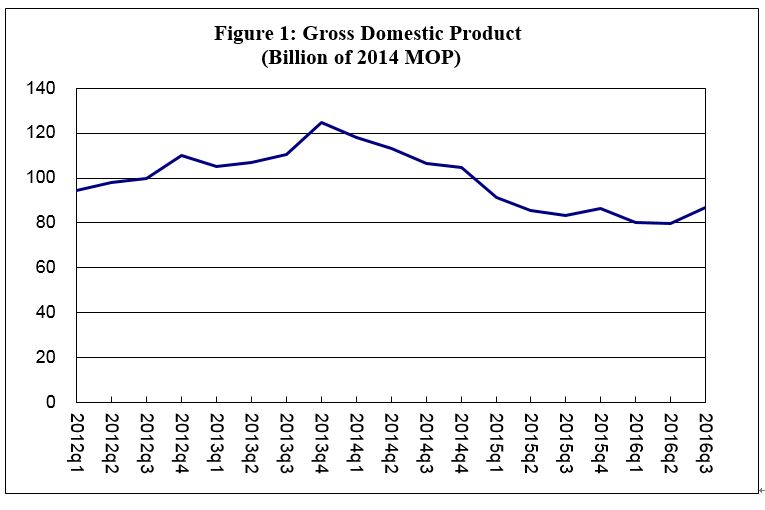
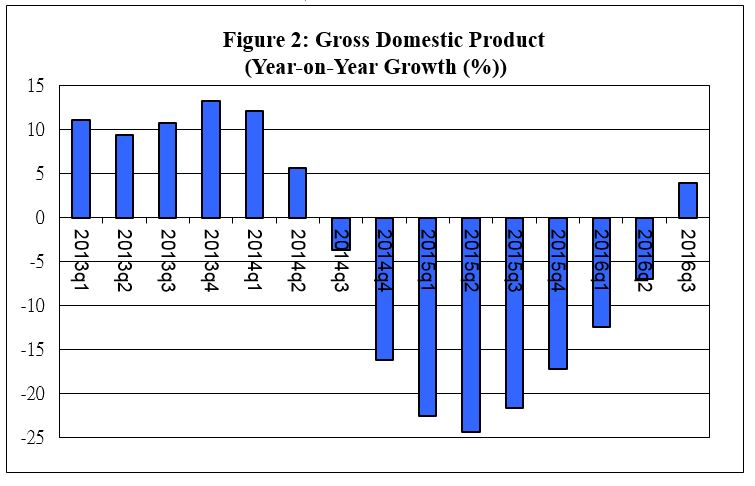
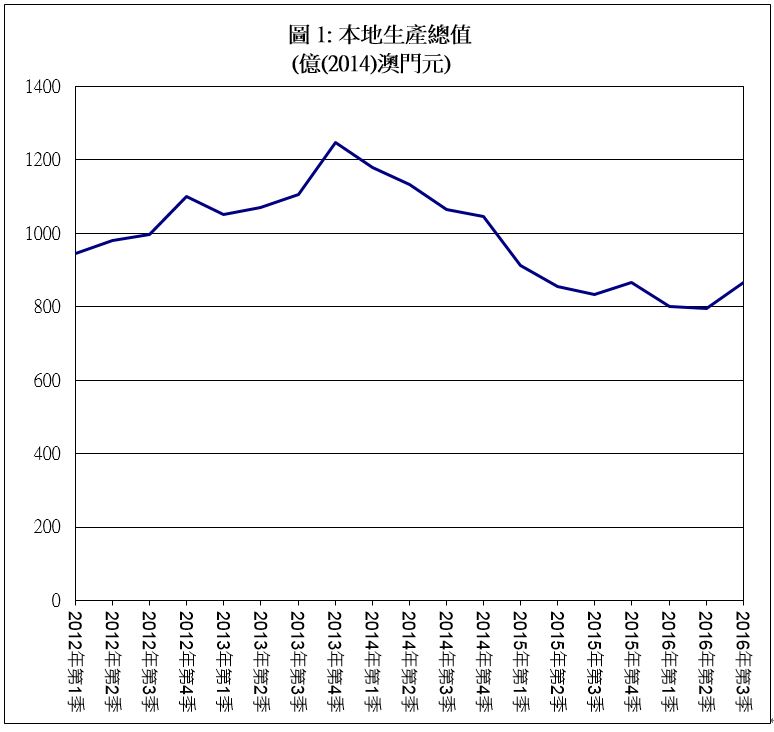
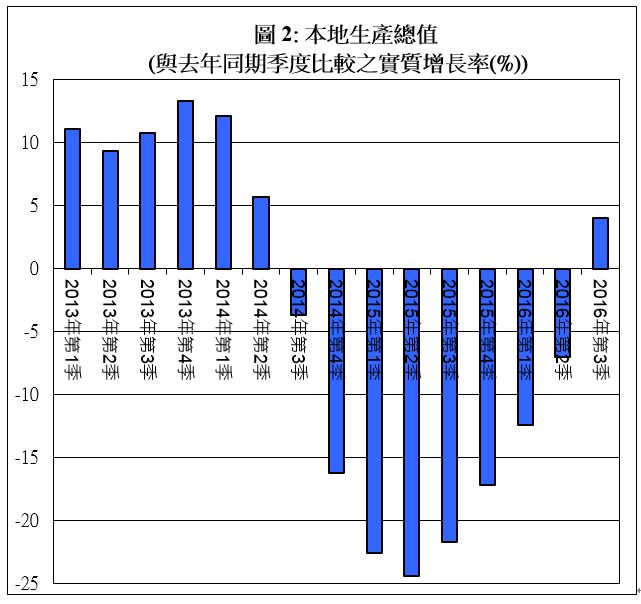
The University of Macau (UM) Department of Economics released its Macroeconomic Forecast for Macao 2017 today. Macao’s economy is beginning to recover. The growth of Macao’s real GDP turned positive, with a 4.0% year-on-year increase and MOP 86.7 billion recorded in the third quarter of 2016. It declined by 12.4% and 7.0% on a year-on-year basis in the first and second quarters of 2016 respectively (Figure 1 and 2). Based on the forecast, Macao’s economy will continue its steady growth in 2017.
Macao’s Economy in 2016
The Macroeconometric Structural Model of Macao was developed by the Nobel laureate Sir James Mirrlees as well as Ho Wai Hung, Liu Chun Wah, Chan Chi Shing, and Kwan Fung from the UM Department of Economics. The following highlights the recent economic situations of the different sectors of Macao’s economy:
· External demand for services was mainly driven by mainland China. With real estate and industrial production growing in 2016, Chinese visitors’ spending in Macao, in particular on gaming activities, went up again. With close to 3-year adjustment, the exports of services were MOP 64.9 billion, up 3.3% on a year-on-year basis in the third quarter of 2016. Meanwhile, the exports of services in gaming, the largest portion of the exports of services, were MOP 41.4 billion, an year-on-year increase of 0.2%.
· In the third quarter of 2016, the nominal gross gaming revenue was MOP 55.2 billion, up 1.1% year-on-year and 6.5% quarter-on-quarter. Revenue from the VIP baccarat was 28.6 MOP billion, down 1.2% year-on-year and up 7.7% quarter-on-quarter.
· In November 2016, total visitor arrivals were 2.59 millions, same as the previous year. Visitors from mainland China recorded 1.71 millions, down 1.2% year-on-year and visitors from Hong Kong were 0.51 millions, down 1.4% year-on-year.
· Exports of goods began to decline in the fourth quarter of 2015. In the third quarter of 2016, the exports of goods continued to shrink. It declined by 15.6% year-on-year to MOP 2.8 billion. The export of textile products and non-textile goods went down by 16.5% and 1.9% year-on-year respectively.
· For the third quarter of 2016, the imports of goods declined by 7.3% year-on-year to MOP 24.8 billion. With the growing demand for gaming services, imports of services increased by 6.2% year-on-year to MOP 7.8 billion.
· Within the imports of goods, consumer goods decreased by 4.5% year-on-year in the third quarter of 2016 amid a sluggish growth in consumer spending. Meanwhile, raw material and semi-manufactures shrank by 32.2% year-on-year with the decline in exports of goods. Capital goods decreased by 6.8% year-on-year.
· Faced with sluggish growth in earnings, Macao’s local residents became cautious in spending, in particular on durable goods. Private consumption expenditure was MOP 22.4 billion, up 0.3% year-on-year in the third quarter of 2016. The household final consumption expenditure in domestic market and the expenditure abroad increased by 0.5% and 4.5% year-on-year respectively.
· Private gross fixed capital formation increased by 2.4% year-on-year in the third quarter of 2016 to MOP 19.5 billion with the opening of new major hotels and casinos in this quarter. Meanwhile, government gross fixed capital formation grew by 1.8% year-on-year. Total gross fixed capital formation increased by 2.3% to MOP 20.9 billion. Private construction investment and private equipment investment grew by 1.3% and 11.2% year-on-year respectively.
· Real estate transaction activity was slower in the third quarter of 2016. The total number of resident units purchased and sold was 2,399, amounting to MOP 14.5 billion, down 19.5% and 4.8% respectively quarter-to-quarter. The average transaction price of the residential units rose by 12.8% quarter-to-quarter to MOP 86,564 per square meter. The average transaction price of the residential units with an area of 50 to 99.9 square meters registered an increase of 6.2% quarter-to-quarter to MOP 81,195 per square meter respectively.
· Inflation rate went down amid sluggish demand from local residents. The Composite Consumer Price Index in November 2016 rose by 1.5% year-on-year. For the two largest components of the Composite Consumer Price Index, food and non-alcoholic beverages, and housing and fuel, their year-on-year growth rates were 2.1% and -1.4% respectively. For the aggregate economy, in tandem with the slowdown of consumer price, the GDP deflator increased by 0.2% year-on-year in the third quarter of 2016.
· The labour market has been stable. Unemployment rate for the third quarter of 2016 was 1.9%, same as in the third quarter of 2015. Excluding non-resident workers, the unemployment rate for local residents was 2.6%, down 0.1 percentage points from the third quarter of 2015.
· The total employment and employment for local residents were 394.2 thousand and 208.8 thousand in the third quarter of 2016, down 0.2% and up 1.2% year-on-year respectively. By industry, employment in wholesales & retails was 45.6 thousand, up 2.2% year-on-year amid slow growth in local spending and employment in hotels & restaurants was 54.8 thousand, up 6.6% year-on-year amid new hotel openings. Employment in construction was 45.1 thousand, a decrease of 14.7% year-on-year along with the finalization in new casinos and hotels. Employment in the gaming industry was 80.5 thousand, down 4.4% year-on-year.
· Median monthly employment earnings were about MOP 15,000 in the third quarter of 2016, same as in the third quarter of 2015. For the gaming sector which accounted for the largest share of the employed population, median monthly employment earnings were about MOP 19,000, same as in the third quarter of 2015. The median monthly employment earnings for the other major industries such as wholesales & retails were about MOP 12,000, same as in the third quarter of 2015 while the median monthly employment earnings for hotels & restaurants were about MOP 10,000, up 5.3% year-on-year.
Macroeconomic Forecast for 2016-2017
According to the IMF forecasts in October 2016, global growth is projected to grow at a rate of 3.4% in 2017, reflecting a more subdued outlook for advanced economies following political uncertainties in the United States and European Union. US GDP is expected to expand at 2.2% and the Euro Area is likely to grow slightly at 1.5%. For mainland China, the GDP growth rate has been stable at 6.7% in the third quarter of 2016. This caused Hong Kong, another major market of Macao’s service exports, to have a slower growth. It grew by 1.9% in the third quarter of 2016. The US Fed has raised its interest rate again in December 2016 and is expected to continue the increase in 2017. The European Central Bank continued its Quantitative Easing to mitigate the possibility of recession and deflation in the eurozone. Mainland China’s GDP is expected to grow at a comparable pace in 2017 amid the Central government’s attempt to stabilise mainland China’s economic growth.
With real estate and industrial production growing up in 2016, Chinese visitors’ gaming spending in Macao went up again. As mainland China is expected to have stabilised growth in 2017, Macao’s exports of services are expected to increase by 2.5% in 2017. Exports of goods declined drastically in 2016 and are expected to decrease by 7.6% in 2017. Concomitant with the slowdown in local consumption, imports of goods are expected to reduce by 0.2% in 2017. Amid the rise in exports of services, the imports of services will expand. The growth rates of imports of services are expected to increase by 4.0% in 2017.
For domestic demand, growth in private consumption spending continued to slow down in 2016, in particular on durable goods. It is expected to grow at 1.8% in 2017. Constructions in new casinos and hotels are expected to continue and total investment is expected to grow 3.8% in 2017.
Inflation, as measured by the change in the Composite Consumer Price Index, is expected to continue to decline amid sluggish demand from local residents. It is expected to be 2.1% in 2017. For the aggregate economy, the GDP price deflator is forecast to increase by 2.2% in 2017.
The labour market became stable. Unemployment rate is forecast to be 2.0% in 2017. Excluding non-resident workers, the unemployment rate of local residents is expected to be 2.6% in 2017. Median monthly employment earnings are forecast to increase by 1.2% in 2017.
For the overall economy, Macao’s GDP is expected to increase by 3.2%, ranging from a pessimistic forecast of -6.9% to an optimistic rate 13.2% in 2017, according to the Macroeconometric Structural Model of Macao. Data and our forecast indicate the possibility of continuous adjustment of Macao’s growth in 2017. Given that the gross gaming revenue is highly influenced by government policies and may adjust greatly throughout the year, reflected in short-term fluctuations. We will update the forecast to reflect the possible adjustment.
About the Macroeconometric Structural Model of Macao
The Macroeconometric Structural Model of Macao is a quarterly simultaneous-equations econometric model which currently includes 88 equations and 162 variables covering seven blocks of the Macao economy — consumption, investment, external sector, prices, government, labour market, and monetary sector. Time series data used starts from the first quarter of 1998 and is updated once new data are available. Its results provide the community with a timely understanding of the state of Macao’s economy and helps decision-makers to make prudent choices for the future.
|
Table: Forecasts of Major Economic Variables |
||||||
|
|
2012 |
2013 |
2014 |
2015 |
2016 |
2017 |
|
Level |
(Actual) |
(Actual) |
(Actual) |
(Actual) |
(Forecast) |
(Forecast) |
|
Gross Domestic Product (Billion of 2014 MOP) |
402.4 |
447.4 |
442.1 |
346.9 |
331.8 |
342.3 |
|
Private Consumption Expenditure (Billion of 2014 MOP) |
78.4 |
83.6 |
88.6 |
90.5 |
90.0 |
91.6 |
|
Gross Fixed Capital Formation (Billion of 2014 MOP) |
55.5 |
60.6 |
83.1 |
87.6 |
75.0 |
77.8 |
|
Exports of Goods (Billion of 2014 MOP) |
11.0 |
11.8 |
14.3 |
15.7 |
12.8 |
11.8 |
|
Exports of Services (Billion of 2014 MOP) |
336.4 |
381.4 |
361.2 |
259.5 |
248.1 |
254.3 |
|
Imports of Goods (Billion of 2014 MOP) |
81.9 |
95.2 |
108.8 |
109.4 |
97.5 |
97.2 |
|
Imports of Services (Billion of 2014 MOP) |
30.5 |
29.1 |
31.0 |
31.2 |
31.5 |
32.7 |
|
GDP Deflator (2013 = 100) |
85.4 |
91.9 |
100.1 |
104.6 |
105.5 |
107.8 |
|
CPI (Composite) (October 2013-September 2014 = 100) |
90.4 |
95.4 |
101.1 |
105.7 |
108.1 |
110.3 |
|
Median Monthly Employment Earnings (MOP) |
11,300 |
12,000 |
13,300 |
15,000 |
15,137 |
15,321 |
|
Employment (Thousand Persons) |
343.2 |
361.0 |
388.1 |
396.5 |
392.8 |
396.4 |
|
Table (Continued) : Forecasts of Major Economic Variables |
|||||||
|
|
2012 |
2013 |
2014 |
2015 |
2016 |
2017 |
|
|
Year-on-Year Growth Rate (%) |
(Actual) |
(Actual) |
(Actual) |
(Actual) |
(Forecast) |
(Forecast) |
|
|
|
Lower |
|
|
|
|
-6.2 |
-6.9 |
|
Gross Domestic Product |
Baseline |
9.2 |
11.2 |
-1.2 |
-21.5 |
-4.4 |
3.2 |
|
|
Upper |
|
|
|
|
-2.5 |
13.2 |
|
|
Lower |
|
|
|
|
-1.5 |
-3.3 |
|
Private Consumption Expenditure |
Baseline |
7.6 |
6.7 |
5.9 |
2.1 |
-0.5 |
1.8 |
|
|
Upper |
|
|
|
|
0.6 |
6.9 |
|
|
Lower |
|
|
|
|
-19.1 |
-23.5 |
|
Gross Fixed Capital Formation |
Baseline |
20.2 |
9.3 |
37.1 |
5.4 |
-14.4 |
3.8 |
|
|
Upper |
|
|
|
|
-9.8 |
31.0 |
|
|
Lower |
|
|
|
|
-22.3 |
-23.9 |
|
Exports of Goods |
Baseline |
30.5 |
7.2 |
20.6 |
10.2 |
-18.4 |
-7.6 |
|
|
Upper |
|
|
|
|
-14.5 |
8.6 |
|
|
Lower |
|
|
|
|
-6.0 |
-8.0 |
|
Exports of Services |
Baseline |
9.9 |
13.4 |
-5.3 |
-28.2 |
-4.4 |
2.5 |
|
|
Upper |
|
|
|
|
-2.7 |
12.9 |
|
|
Lower |
|
|
|
|
-12.6 |
-9.7 |
|
Imports of Goods |
Baseline |
14.7 |
16.2 |
14.3 |
0.6 |
-10.9 |
-0.2 |
|
|
Upper |
|
|
|
|
-9.3 |
9.2 |
|
|
Lower |
|
|
|
|
-2.0 |
-6.3 |
|
Imports of Services |
Baseline |
13.1 |
-4.5 |
6.7 |
0.4 |
1.0 |
4.0 |
|
|
Upper |
|
|
|
|
4.0 |
14.3 |
|
|
Lower |
|
|
|
|
0.3 |
-1.2 |
|
GDP Deflator Growth Rate |
Baseline |
7.0 |
7.7 |
8.9 |
4.5 |
0.9 |
2.2 |
|
|
Upper |
|
|
|
|
1.5 |
5.6 |
|
|
Lower |
|
|
|
|
2.0 |
0.0 |
|
CPI (Composite) Inflation Rate |
Baseline |
6.1 |
5.5 |
6.1 |
4.5 |
2.2 |
2.1 |
|
|
Upper |
|
|
|
|
2.5 |
4.2 |
|
|
Lower |
|
|
|
|
0.0 |
-3.4 |
|
Median Monthly Employment Earnings |
Baseline |
13.0 |
6.2 |
10.8 |
12.8 |
0.9 |
1.2 |
|
|
Upper |
|
|
|
|
1.8 |
5.9 |
|
|
Lower |
|
|
|
|
1.8 |
1.4 |
|
Unemployment Rate |
Baseline |
2.0 |
1.8 |
1.7 |
1.8 |
1.9 |
2.0 |
|
|
Upper |
|
|
|
|
1.9 |
2.5 |
|
|
Lower |
|
|
|
|
2.5 |
1.9 |
|
Unemployment Rate |
Baseline |
2.6 |
2.4 |
2.3 |
2.5 |
2.6 |
2.6 |
|
(Local Residents) |
Upper |
|
|
|
|
2.7 |
3.4 |
Media Contact Information:
Communications Office, University of Macau
Albee Lei Tel:(853) 88228004
Kelvin U Tel:(853) 88224322
Email:prs.media@um.edu.mo
UM Website:www.umac.mo